
China Tea Export Analysis Report
October 2025
Report Date: December 04, 2025
EXECUTIVE SUMMARY
Overall Performance: China’s tea exports for the first ten months of 2025 totaled 343.61 million KG, representing a 3.8% increase compared to the same period in 2024 (330.88 million KG).
Key Highlights:
- Pure green tea (绿茶) exports grew by 13.5%, reaching 301.71 million KG
- Total unfermented teas represent 89.8% of exports, totaling 308.46 million KG
- Black tea (红茶) exports decreased 51.1%, falling to 21.72 million KG
- October 2025 showed -2.3% decline vs October 2024
- Morocco remains #1 destination with 78.71 million KG YTD (+20.4%)
- African markets dominate top 10, representing majority of exports
- Ghana continued sharp decline: -54.8% YTD
- Côte d’Ivoire explosive growth: +324.2% YTD
1. YEAR-TO-DATE PERFORMANCE (JAN-OCT 2025)
1.1 Total Export Volume
| 2025 YTD (Jan-Oct) | 2024 YTD (Jan-Oct) | Change |
| 343,605,194 KG | 330,876,413 KG | +12,728,781 KG (+3.8%) |
1.2 Green Tea (绿茶) Volume
Note: Pure green tea only, excluding jasmine tea, flower tea, and white tea (reported separately below).
| 2025 YTD | 2024 YTD | Change |
| 301,713,836 KG | 265,921,638 KG | +35,792,198 KG (+13.5%) |
1.2.1 Other Unfermented Tea Categories
In addition to pure green tea, the following unfermented tea categories contributed to total exports:
- Jasmine Tea (茉莉花茶): 5,779,859 KG (+13.4% vs 2024 YTD)
- White Tea (白茶): 357,076 KG (+0.7% vs 2024 YTD)
- Other Flower Tea (其他花茶): 607,800 KG (-42.7% vs 2024 YTD)
- Total All Unfermented Teas: 308,458,571 KG (representing 89.8% of total exports)
1.3 Black Tea (红茶) Volume Volume
| 2025 YTD | 2024 YTD | Change |
| 21,724,914 KG | 44,383,708 KG | -22,658,794 KG (-51.1%) |
2. OCTOBER 2025 PERFORMANCE
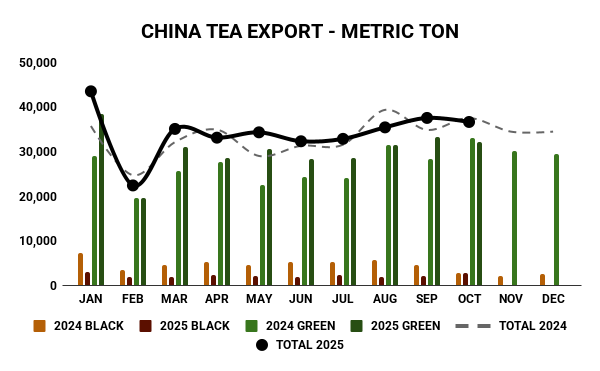
2.1 Total Export Volume
| October 2025 | October 2024 | Change |
| 36,634,122 KG | 37,505,895 KG | -871,773 KG (-2.3%) |
2.2 Green Tea (绿茶) – October
Pure green tea only (excluding jasmine, flower, and white tea)
| October 2025 | October 2024 | Change |
| 32,098,774 KG | 33,080,043 KG | -981,269 KG (-3.0%) |
2.3 Black Tea (红茶) – October
| October 2025 | October 2024 | Change |
| 2,726,864 KG | 2,641,366 KG | +85,498 KG (+3.2%) |
3. TOP 10 DESTINATIONS – YTD
| Rank | Country | 2025 KG | 2024 KG | Change % |
|---|---|---|---|---|
| 1 | 摩洛哥 (Morocco) | 78,711,450 | 65,369,431 | +20.4% |
| 2 | 乌兹别克斯坦 (Uzbekistan) | 24,655,916 | 17,166,037 | +43.6% |
| 3 | 塞内加尔 (Senegal) | 20,418,052 | 12,411,544 | +64.5% |
| 4 | 毛里塔尼亚 (Mauritania) | 15,680,864 | 13,829,838 | +13.4% |
| 5 | 加纳 (Ghana) | 15,079,246 | 33,360,202 | -54.8% |
| 6 | 俄罗斯 (Russia) | 13,258,143 | 12,253,239 | +8.2% |
| 7 | 科特迪瓦 (Côte d’Ivoire) | 13,016,779 | 3,068,280 | +324.2% |
| 8 | 阿尔及利亚 (Algeria) | 12,422,686 | 10,176,179 | +22.1% |
| 9 | 乍得 (Chad) | 9,707,354 | 4,465,793 | +117.4% |
| 10 | 日本 (Japan) | 9,382,236 | 8,601,903 | +9.1% |
Key Insights:
- 8 of top 10 destinations are African countries, dominating China’s tea export landscape
- Côte d’Ivoire shows explosive growth (+324.2%)
- Senegal demonstrates strong growth trajectory (+64.5%)
- Ghana’s dramatic reversal: from growth star (2022-2024) to sharp decline (-54.8%)
- Uzbekistan recovery momentum (+43.6% after 2022-2024 decline)
4. TOP 10 DESTINATIONS – OCTOBER 2025
| Rank | Country | 2025 KG | 2024 KG | Change % |
|---|---|---|---|---|
| 1 | 摩洛哥 (Morocco) | 10,140,583 | 9,722,794 | +4.3% |
| 2 | 乌兹别克斯坦 (Uzbekistan) | 3,237,176 | 2,353,880 | +37.5% |
| 3 | 科特迪瓦 (Côte d’Ivoire) | 2,331,064 | 917,380 | +154.1% |
| 4 | 毛里塔尼亚 (Mauritania) | 1,790,342 | 2,111,531 | -15.2% |
| 5 | 塞内加尔 (Senegal) | 1,652,076 | 1,367,471 | +20.8% |
| 6 | 阿尔及利亚 (Algeria) | 1,311,421 | 1,587,062 | -17.4% |
| 7 | 美国 (USA) | 1,282,442 | 948,162 | +35.3% |
| 8 | 德国 (Germany) | 954,559 | 1,182,462 | -19.3% |
| 9 | 日本 (Japan) | 922,415 | 758,545 | +21.6% |
| 10 | 乍得 (Chad) | 916,486 | 591,263 | +55.0% |
October Highlights:
- Côte d’Ivoire maintained explosive growth momentum (+154.1%)
- USA demonstrated strong recovery (+35.3%), re-entering top 10
- Uzbekistan consistent strong performer (+37.5%)
- Mauritania, Algeria, and Germany showed October weakness
5. TEA TYPE ANALYSIS BY DESTINATION
5.1 YTD Top 10 Countries – Tea Type Breakdown
| Country | Green Tea KG | Black Tea KG | Other Types KG |
|---|---|---|---|
| 摩洛哥 (Morocco) | 78,285,634 | 8,050 | 417,766 |
| 乌兹别克斯坦 (Uzbekistan) | 24,472,186 | 164,160 | 19,570 |
| 塞内加尔 (Senegal) | 20,161,295 | 0 | 256,757 |
| 毛里塔尼亚 (Mauritania) | 15,680,864 | 0 | 0 |
| 加纳 (Ghana) | 15,045,574 | 72 | 33,600 |
| 俄罗斯 (Russia) | 8,984,175 | 1,914,936 | 2,359,032 |
| 科特迪瓦 (Côte d’Ivoire) | 12,811,359 | 40,020 | 165,400 |
| 阿尔及利亚 (Algeria) | 12,349,620 | 73,066 | 0 |
| 乍得 (Chad) | 9,707,354 | 0 | 0 |
| 日本 (Japan) | 1,004,996 | 255,813 | 8,121,427 |
5.2 October 2025 Top 10 – Tea Type Breakdown
| Country | Green Tea KG | Black Tea KG | Other Types KG |
|---|---|---|---|
| 摩洛哥 (Morocco) | 10,074,343 | 0 | 66,240 |
| 乌兹别克斯坦 (Uzbekistan) | 3,232,877 | 2,680 | 1,619 |
| 科特迪瓦 (Côte d’Ivoire) | 2,298,664 | 0 | 32,400 |
| 毛里塔尼亚 (Mauritania) | 1,790,342 | 0 | 0 |
| 塞内加尔 (Senegal) | 1,598,996 | 0 | 53,080 |
| 阿尔及利亚 (Algeria) | 1,311,421 | 0 | 0 |
| 美国 (USA) | 587,916 | 577,965 | 116,561 |
| 德国 (Germany) | 622,682 | 238,328 | 93,549 |
| 日本 (Japan) | 239,802 | 11,449 | 671,164 |
| 乍得 (Chad) | 916,486 | 0 | 0 |
Tea Type Preferences by Market:
- African markets: Overwhelmingly prefer pure green tea (95-100%), with minimal diversification
- Morocco: 99.5% green tea – largest single market
- Russia: Diverse portfolio (68% green, 14% black, 18% specialty teas)
- Japan: Preference for specialty teas (73% oolong/dark, 27% green/black)
- USA: Balanced mix (46% green, 45% black, 9% other)
- Germany: Mixed portfolio (65% green, 25% black, 10% other)
6. THREE-YEAR TREND ANALYSIS
Total Export Volumes
- 2022: 375.19M KG (baseline)
- 2023: 367.54M KG (-2.0% vs 2022)
- 2024: 399.79M KG (+8.8% vs 2023)
- 2025 YTD: 343.61M KG (10 months)
- 2025 Annualized: 412.33M KG (+3.1% projected)
Green Tea (绿茶) Trend
Pure green tea only (excluding jasmine, flower, white)
- 2022: 313.84M KG (83.6% of total)
- 2023: 309.35M KG (-1.4%, 84.2% of total)
- 2024: 325.37M KG (+5.2%, 81.4% of total)
- 2025 YTD: 301.71M KG (87.8% of total)
Black Tea (红茶) Trend
- 2022: 33.24M KG (8.9% of total)
- 2023: 29.04M KG (-12.6%, 7.9% of total)
- 2024: 48.99M KG (+68.7%, 12.3% of total) ← Strong growth
- 2025 YTD: 21.72M KG (-55.7%, 6.3% of total) ← COLLAPSE
Key Trend Observations
- Green tea dominance intensifying: Rising from 81.4% (2024) to 87.8% (2025 YTD)
- Black tea dramatic reversal: After +68.7% growth in 2024, collapsed -55.7% in 2025
- Unfermented teas historic high: 89.8% of total (green + jasmine + flower + white)
- Specialty teas declining: Oolong (-25.7% YTD), Dark tea/Puerh also declining
7. KEY FINDINGS & INSIGHTS
7.1 DECLINES
- GHANA MARKET DECREASE
- -54.8% YTD after being fastest grower (2022-2024: +57.6%)
- Lost 18.3 million KG, dropped from #2 to #5
- OCTOBER NEGATIVE MOMENTUM
- First month with negative growth (-2.3%)
- Suggests Q4 challenges ahead, could impact full-year performance
7.2 GAINS
- WEST AFRICAN EXPANSION
- Côte d’Ivoire: +324.2% YTD (3.1M → 13.0M KG) – Exceptional growth
- Chad: +117.4% YTD (4.5M → 9.7M KG)
- Senegal: +64.5% YTD (12.4M → 20.4M KG)
- UZBEKISTAN RECOVERY
- +43.6% YTD after 2-year decline, back to #2 position
- MOROCCO STABILITY
- Consistent #1 destination with +20.4% YTD growth
- 78.7M KG (22.9% of total exports), reliable and growing
- DEVELOPED MARKETS REVIVAL
- USA: +35.3% in October, Japan: +21.6% in October
*This report was produced with the assistance of an AI agent. It was reviewed by Firsd Tea, but it is for informational purposes.