
China Tea Export and US Tea Import Report
For China Customs and USDA trade data to October 2025*
Report Date: January 14, 2026
1. EXECUTIVE SUMMARY AND KEY HIGHLIGHTS
China Exports
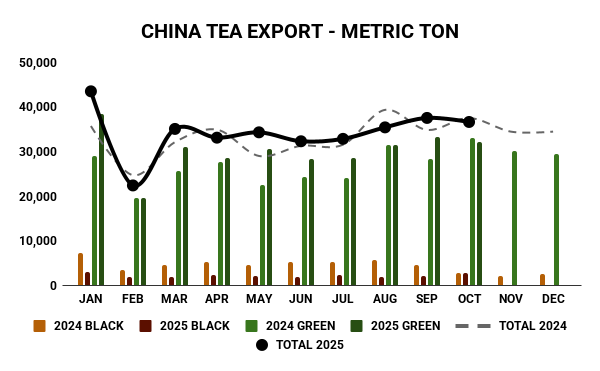
China’s tea exports for the first ten months of 2025 totaled 343,058 metric tons, representing a 3.7% increase compared to the same period in 2024. Green tea exports rose 13.4%, now accounting for 87.9% of total exports. However, black tea exports receded by 54.9%.
US Imports
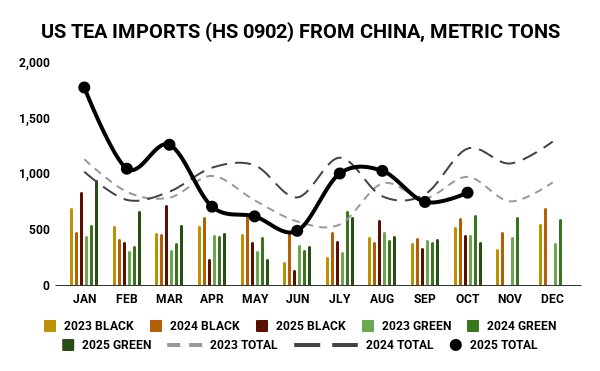
US tea imports from China through October 2025 totaled 9,497 metric tons, essentially flat (-0.3%) compared to 2024. China green tea imports increased 11.5%, representing 32.3% of total US green tea imports. Black tea and organic tea imports from China both declined approximately 11% year-to-date.
Key Highlights:
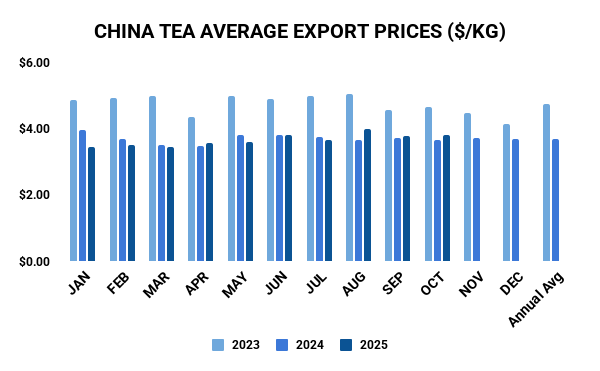
• China export prices increased 4.1% to $3.81/kg in October
• October China exports declined 2.3% year-over-year
• US imports from China fell 32.3% in October
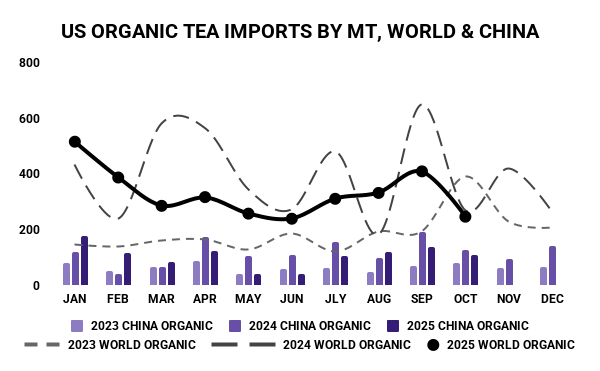
• China organic tea imports declined 11.0%, but still represent 31.7% of US organic market
»» DOWNLOAD THE FULL REPORT HERE ««
2. CHINA EXPORTS
2.1 Total Exports Year-to-Date
| 2025 YTD (Jan-Oct) | 2024 YTD (Jan-Oct) | Change |
| 343,058 MT | 330,877 MT | +12,181 MT (3.7%) |
2.2 October 2025 vs October 2024
| October 2025 | October 2024 | Change |
| 36,627 MT | 37,506 MT | -879 MT (-2.3%) |
2.3 Green Tea Year-to-Date
| 2025 YTD | 2024 YTD | Change |
| 301,647 MT | 265,920 MT | +35,727 MT (13.4%) |
2.4 Green Tea as Percentage of Total YTD: 87.9%
Green tea now represents nearly 88% of total China tea exports, up from 80% in 2024, reflecting strong global demand and China’s strategic focus on green tea production.
2.5 October 2025 Green Tea
| October 2025 | October 2024 | Change |
| 32,099 MT | 33,080 MT | -981 MT (-3.0%) |
2.6 Black Tea Year-to-Date
| 2025 YTD | 2024 YTD | Change |
| 21,350 MT | 47,384 MT | -26,034 MT (-54.9%) |
2.7 Black Tea as Percentage of Total YTD: 6.2%
Black tea has fallen to just 6.2% of total exports, down from 14.3% in 2024.
2.8 October 2025 Black Tea
| October 2025 | October 2024 | Change |
| 2,719 MT | 2,641 MT | +78 MT (3.0%) |
2.9 Average Export Price per Kilogram
| October 2025 | October 2024 | Change |
| $3.81/kg | $3.66/kg | +$0.15 (4.1%) |
2.10 Notable Trends Over Past 24 Months
Price Recovery
After declining from $6.23/kg in 2021 to $3.70/kg in 2024, China tea export prices have averaged $3.66/kg YTD through October with an upward trajectory in recent months.
Green Tea Dominance
Green tea has become increasingly dominant, growing from 80% of exports in 2024 to 88% in 2025.
3. US IMPORTS
3.1 Total World Imports Year-to-Date
| 2025 YTD (Jan-Oct) | 2024 YTD (Jan-Oct) | Change |
| 15,625 MT | 14,718 MT | +907 MT (6.2%) |
3.2 October 2025 China Imports
| October 2025 | October 2024 | Change |
| 830 MT | 1,226 MT | -396 MT (-32.3%) |
3.3 China Green Tea Imports Year-to-Date
| 2025 YTD | 2024 YTD | Change |
| 5,054 MT | 4,532 MT | +522 MT (11.5%) |
3.4 China Green Tea as % of US Total Green Tea Imports: 32.3%
China accounts for approximately one-third of US green tea imports, maintaining its position as the leading supplier.
3.5 October 2025 China Green Tea
| October 2025 | October 2024 | Change |
| 384 MT | 626 MT | -242 MT (-38.7%) |
3.6 China Black Tea Imports Year-to-Date
| 2025 YTD | 2024 YTD | Change |
| 4,441 MT | 4,991 MT | -550 MT (-11.0%) |
3.7 October 2025 China Black Tea
| October 2025 | October 2024 | Change |
| 446 MT | 600 MT | -154 MT (-25.7%) |
3.8 October 2025 China Organic Tea
| October 2025 | October 2024 | Change |
| 107 MT | 127 MT | -20 MT (-15.7%) |
3.9 China Organic Tea Year-to-Date
| 2025 YTD | 2024 YTD | Change |
| 1,045 MT | 1,174 MT | -129 MT (-11.0%) |
3.10 China Organic as % of US Total Organic Imports: 31.7%
Despite the YTD decline, China maintains approximately one-third of the US organic tea market.
4. KEY FINDINGS AND INSIGHTS
4.1 Overall Market Dynamics
Export-Import Disconnect
While China’s total exports grew 3.7% YTD, US imports from China remained essentially flat (-0.3%); a further indication that tariffs likely had an impact.
4.2 Tea Type Trends
Green Tea Strength
Green tea performance remains robust on both export (+13.4% China exports) and import (+11.5% US imports from China) sides.
4.3 Conclusion
The China-US tea trade through October 2025 presents a nuanced picture of transformation and challenge. China’s export sector is experiencing a fundamental shift toward green tea dominance (88% of exports) while managing a black tea contraction (-54.9% YTD). The October data suggests potential stabilization in black tea and continued price recovery, but also reveals concerning month-over-month volatility.
From the US import perspective, China maintains critical market positions in green tea (32.3% share) and organic (31.7% share), though volumes show pressures in both categories. The sharp October decline in US imports from China (-32.3%) warrants close attention, as tariff rates were reduced in early November.
Key Takeaways:
1. Green tea trends are positive across both markets
2. China’s market share positions remain strong despite volume pressures
* This report was produced with the assistance of an AI agent. It was reviewed and edited by Firsd Tea, but may contain data errors. Please consult original data sources for verification.
— END OF REPORT —