
China Tea Export Analysis Report
September 2025
Report Date: November 11, 2025
EXECUTIVE SUMMARY
Overall Performance: China’s tea exports for the first nine months of 2025 totaled 306.97 million KG, representing a 4.6% increase compared to the same period in 2024 (293.37 million KG).
Key Highlights:
• Pure green tea (绿茶) exports surged by 15.8%, reaching 269.62 million KG
• Total unfermented teas (including jasmine, flower, and white tea) represent 89.8% of exports, totaling 275.53 million KG
• Black tea (红茶) exports declined sharply by 54.5%, falling to 19.00 million KG
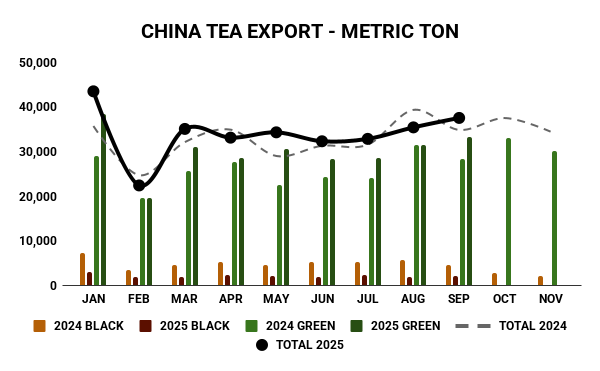
• September 2025 showed strong momentum with a 7.7% increase over September 2024
• Morocco, Uzbekistan, and Senegal lead as top destinations with significant growth
• African markets dominate the top 10, accounting for the majority of export volumes
»» DOWNLOAD THE FULL REPORT ««
1. YEAR-TO-DATE PERFORMANCE (JAN-SEP 2025)
1.1 Total Export Volume
| 2025 YTD (Jan-Sep) | 2024 YTD (Jan-Sep) | Change |
| 306,971,072 KG | 293,370,518 KG | +13,600,554 KG (+4.6%) |
1.2 Green Tea (绿茶) Volume
Note: Pure green tea only, excluding jasmine tea, flower tea, and white tea (which are reported separately below).
| 2025 YTD | 2024 YTD | Change |
| 269,615,062 KG | 232,841,595 KG | +36,773,467 KG (+15.8%) |
1.2.1 Other Unfermented Tea Categories
In addition to pure green tea, the following unfermented tea categories contributed to total exports:
- Jasmine Tea (茉莉花茶): 5,464,868 KG (+15.3% vs 2024 YTD)
- Other Flower Tea (其他花茶): 108,472 KG (-32.0% vs 2024 YTD)
- White Tea (白茶): 341,235 KG (+1.5% vs 2024 YTD)
- Total All Unfermented Teas: 275,529,637 KG (representing 89.8% of total exports)
1.3 Black Tea (红茶) Volume
| 2025 YTD | 2024 YTD | Change |
| 18,998,050 KG | 41,742,342 KG | -22,744,292 KG (-54.5%) |
2. SEPTEMBER 2025 PERFORMANCE

2.1 Total Export Volume
| September 2025 | September 2024 | Change |
| 37,534,871 KG | 34,837,852 KG | +2,697,019 KG (+7.7%) |
2.2 Green Tea (绿茶) – September
Pure green tea only (excluding jasmine, flower, and white tea)
| September 2025 | September 2024 | Change |
| 33,352,942 KG | 28,334,961 KG | +5,017,981 KG (+17.7%) |
2.3 Black Tea (红茶) – September
| September 2025 | September 2024 | Change |
| 2,028,719 KG | 4,545,594 KG | -2,516,875 KG (-55.4%) |
3. TOP 10 EXPORT DESTINATIONS – YTD
Year-to-date ranking (January – September 2025) compared to same period in 2024:
| Rank | Country | 2025 YTD KG | 2024 YTD KG | Change % |
|---|---|---|---|---|
| 1 | 摩洛哥 (Morocco) | 68,570,867 | 55,646,637 | +23.2% |
| 2 | 乌兹别克斯坦 (Uzbekistan) | 21,418,740 | 14,812,157 | +44.6% |
| 3 | 塞内加尔 (Senegal) | 18,765,976 | 11,044,073 | +69.9% |
| 4 | 加纳 (Ghana) | 14,171,874 | 30,907,490 | -54.1% |
| 5 | 毛里塔尼亚 (Mauritania) | 13,890,522 | 11,718,307 | +18.5% |
| 6 | 俄罗斯 (Russia) | 12,350,819 | 11,316,827 | +9.1% |
| 7 | 阿尔及利亚 (Algeria) | 11,111,265 | 8,589,117 | +29.4% |
| 8 | 科特迪瓦 (Côte d’Ivoire) | 10,685,715 | 2,150,900 | +396.8% |
| 9 | 乍得 (Chad) | 8,790,868 | 3,874,530 | +126.9% |
| 10 | 日本 (Japan) | 8,459,821 | 7,843,358 | +7.9% |
Key Insights:
- African markets dominate: 8 out of 10 top destinations are African countries, highlighting the continent’s critical importance to China’s tea export strategy.
- Exceptional growth in West Africa: Côte d’Ivoire (+396.8%), Chad (+126.9%), and Senegal (+69.9%) show explosive growth.
- Ghana’s sharp decline: The fourth-largest market experienced a 54.1% drop, losing over 16 million KG in volume.
- Japan remains stable: The only Asian market in the top 10, showing steady 7.9% growth.
4. TOP 10 EXPORT DESTINATIONS – SEPTEMBER 2025
September 2025 rankings compared to September 2024:
| Rank | Country | 2025 YTD KG | 2024 YTD KG | Change % |
|---|---|---|---|---|
| 1 | 摩洛哥 (Morocco) | 8,395,807 | 6,441,754 | +30.3% |
| 2 | 乌兹别克斯坦 (Uzbekistan) | 3,155,907 | 1,411,896 | +123.5% |
| 3 | 毛里塔尼亚 (Mauritania) | 2,730,711 | 1,726,795 | +58.1% |
| 4 | 塞内加尔 (Senegal) | 2,211,503 | 1,794,909 | +23.2% |
| 5 | 科特迪瓦 (Côte d’Ivoire) | 1,589,120 | 685,740 | +131.7% |
| 6 | 阿尔及利亚 (Algeria) | 1,506,797 | 1,204,380 | +25.1% |
| 7 | 加纳 (Ghana) | 1,373,645 | 3,205,162 | -57.1% |
| 8 | 马里 (Mali) | 1,258,586 | 257,201 | +389.3% |
| 9 | 喀麦隆 (Cameroon) | 1,113,786 | 1,036,520 | +7.5% |
| 10 | 冈比亚 (Gambia) | 1,097,180 | 690,500 | +58.9% |
September Highlights:
- Mali’s remarkable surge: A 389.3% increase.
- Uzbekistan doubles exports: 123.5% growth.
- Ghana continues decline: 57.1% drop in September reflects the broader YTD trend.
5. TEA TYPE ANALYSIS BY DESTINATION
5.1 YTD Top 10 Countries – Tea Type Breakdown
Note: Green tea shown separately from jasmine, flower, and white teas. ‘Other’ includes oolong and dark/puerh teas.
| Country | Green Tea | Jasmine | Flower/White | Black Tea | Other | Total |
|---|---|---|---|---|---|---|
| 摩洛哥 (Morocco) | 68,211,291 | 348,380 | 200 | 8,050 | 2,946 | 68,570,867 |
| 乌兹别克斯坦 (Uzbekistan) | 21,239,309 | 15,011 | 0 | 161,480 | 2,940 | 21,418,740 |
| 塞内加尔 (Senegal) | 18,562,299 | 198,116 | 5,561 | 0 | 0 | 18,765,976 |
| 加纳 (Ghana) | 14,152,874 | 19,000 | 0 | 0 | 0 | 14,171,874 |
| 毛里塔尼亚 (Mauritania) | 13,890,522 | 0 | 0 | 0 | 0 | 13,890,522 |
| 俄罗斯 (Russia) | 8,375,105 | 516,981 | 5,795 | 1,711,761 | 1,741,177 | 12,350,819 |
| 阿尔及利亚 (Algeria) | 11,038,199 | 0 | 0 | 73,066 | 0 | 11,111,265 |
| 科特迪瓦 (Côte d’Ivoire) | 10,512,695 | 133,000 | 0 | 40,020 | 0 | 10,685,715 |
| 乍得 (Chad) | 8,790,868 | 0 | 0 | 0 | 0 | 8,790,868 |
| 日本 (Japan) | 765,194 | 1,878,054 | 505 | 244,364 | 5,571,704 | 8,459,821 |
5.2 September 2025 Top 10 – Tea Type Breakdown
| Country | Green Tea | Jasmine | Flower/White | Black Tea | Other | Total |
|---|---|---|---|---|---|---|
| 摩洛哥 (Morocco) | 8,395,807 | 0 | 0 | 0 | 0 | 8,395,807 |
| 乌兹别克斯坦 (Uzbekistan) | 3,134,319 | 235 | 0 | 21,137 | 216 | 3,155,907 |
| 毛里塔尼亚 (Mauritania) | 2,730,711 | 0 | 0 | 0 | 0 | 2,730,711 |
| 塞内加尔 (Senegal) | 2,141,359 | 65,664 | 4,480 | 0 | 0 | 2,211,503 |
| 科特迪瓦 (Côte d’Ivoire) | 1,580,120 | 9,000 | 0 | 0 | 0 | 1,589,120 |
| 阿尔及利亚 (Algeria) | 1,506,797 | 0 | 0 | 0 | 0 | 1,506,797 |
| 加纳 (Ghana) | 1,373,645 | 0 | 0 | 0 | 0 | 1,373,645 |
| 马里 (Mali) | 1,258,586 | 0 | 0 | 0 | 0 | 1,258,586 |
| 喀麦隆 (Cameroon) | 1,113,786 | 0 | 0 | 0 | 0 | 1,113,786 |
| 冈比亚 (Gambia) | 1,097,180 | 0 | 0 | 0 | 0 | 1,097,180 |
Tea Type Preferences by Market:
- African markets: Overwhelmingly prefer pure green tea (typically 95-99%), with Morocco and Senegal showing small jasmine tea purchases.
- Russia: Diverse portfolio with 68% pure green tea, 4% jasmine tea, 14% black tea, and 14% specialty teas (oolong, dark tea).
- Japan: Highly specialized market preferring premium varieties: 22% jasmine tea, 66% oolong and dark tea, with minimal pure green tea (9%).
- Uzbekistan: Almost exclusively pure green tea (99.2%) with small volumes of black tea and jasmine tea.
6. THREE-YEAR TREND ANALYSIS (2022-2025)
6.1 Total Export Volumes
| Year | Total KG | YoY Change | YoY % |
|---|---|---|---|
| 2022 | 375,194,571 | — | — |
| 2023 | 367,541,867 | -7,652,704 | -2.0% |
| 2024 | 399,785,446 | +32,243,579 | +8.8% |
| 2025 (9 months) | 306,971,072 | -92,814,374 | -23.2% |
| 2025 (annualized)* | 409,294,763 | +9,509,317 | +2.4%* |
*Annualized estimate based on 9 months of data. Actual full-year results may vary due to seasonal factors.
6.2 Green Tea (绿茶) Trend
Pure green tea only, excluding jasmine tea, flower tea, and white tea
| Year | Volume KG | YoY Change | YoY % | % Total |
|---|---|---|---|---|
| 2022 | 313,839,367 | — | — | 83.6% |
| 2023 | 309,348,786 | -4,490,581 | -1.4% | 84.2% |
| 2024 | 325,373,208 | +16,024,422 | +5.2% | 81.4% |
| 2025 (9 mo) | 269,615,062 | -55,758,146 | -17.1% | 87.8% |
6.2.1 Other Unfermented Tea Categories
Jasmine Tea (茉莉花茶)
| Year | Volume KG | YoY Change | YoY % | % Total |
|---|---|---|---|---|
| 2022 | 0 | — | — | 0.0% |
| 2023 | 6,210,552 | — | — | 1.7% |
| 2024 | 6,957,616 | +747,064 | +12.0% | 1.7% |
| 2025 (9 mo) | 5,464,868 | -1,492,748 | -21.5% | 1.8% |
White Tea (白茶)
| Year | Volume KG | YoY Change | YoY % | % Total |
|---|---|---|---|---|
| 2022 | 0 | — | — | 0.0% |
| 2023 | 621,253 | — | — | 0.2% |
| 2024 | 438,608 | -182,645 | -29.4% | 0.1% |
| 2025 (9 mo) | 341,235 | -97,373 | -22.2% | 0.1% |
Total Unfermented Teas Summary
Combined total of all unfermented teas (green + jasmine + flower + white): 275.53 million KG YTD 2025, representing 89.8% of total exports.
6.3 Black Tea (红茶) Trend
| Year | Volume KG | YoY Change | YoY % | % Total |
|---|---|---|---|---|
| 2022 | 33,239,276 | — | — | 8.9% |
| 2023 | 29,044,194 | -4,195,082 | -12.6% | 7.9% |
| 2024 | 48,989,076 | +19,944,882 | +68.7% | 12.3% |
| 2025 (9 mo) | 18,998,050 | -29,991,026 | -61.2% | 6.2% |
6.4 Oolong Tea (乌龙茶) Trend
| Year | Volume KG | YoY Change | YoY % | % Total |
|---|---|---|---|---|
| 2022 | 19,343,109 | — | — | 5.2% |
| 2023 | 19,925,581 | +582,472 | +3.0% | 5.4% |
| 2024 | 15,962,952 | -3,962,629 | -19.9% | 4.0% |
| 2025 (9 mo) | 11,042,026 | -4,920,926 | -30.8% | 3.6% |
6.5 Dark Tea/Puerh (黑茶) Trend
| Year | Volume KG | YoY Change | YoY % | % Total |
|---|---|---|---|---|
| 2022 | 2,266,073 | — | — | 0.6% |
| 2023 | 2,146,299 | -119,774 | -5.3% | 0.6% |
| 2024 | 1,877,087 | -269,212 | -12.5% | 0.5% |
| 2025 (9 mo) | 1,401,359 | -475,728 | -25.3% | 0.5% |
7. SIGNIFICANT MARKET CHANGES
7.1 Top 15 Markets – Historical Comparison
| Country | 2022 | 2023 | 2024 | 2025 YTD | CAGR |
|---|---|---|---|---|---|
| 摩洛哥 (Morocco) | 75,439,886 | 59,831,511 | 80,583,684 | 68,570,867 | +3.4% |
| 加纳 (Ghana) | 24,510,533 | 35,289,670 | 38,622,481 | 14,171,874 | +25.5% |
| 乌兹别克斯坦 (Uzbekistan) | 24,941,345 | 27,254,049 | 21,973,771 | 21,418,740 | -6.1% |
| 塞内加尔 (Senegal) | 17,156,390 | 16,677,813 | 15,145,190 | 18,765,976 | -6.0% |
| 俄罗斯 (Russia) | 19,717,570 | 14,759,323 | 15,929,967 | 12,350,819 | -10.1% |
| 毛里塔尼亚 (Mauritania) | 12,591,611 | 15,825,529 | 15,860,443 | 13,890,522 | +12.2% |
| 阿尔及利亚 (Algeria) | 11,462,439 | 20,265,540 | 13,795,299 | 11,111,265 | +9.7% |
| 美国 (USA) | 13,004,230 | 8,619,464 | 11,647,738 | 7,573,931 | -5.4% |
| 日本 (Japan) | 9,586,293 | 10,317,708 | 10,172,770 | 8,459,821 | +3.0% |
| 德国 (Germany) | 10,615,668 | 9,000,726 | 9,478,930 | 7,050,477 | -5.5% |
| 马里 (Mali) | 9,249,023 | 11,956,421 | 6,608,414 | 7,544,768 | -15.5% |
| 喀麦隆 (Cameroon) | 11,172,002 | 10,173,366 | 7,439,446 | 6,367,745 | -18.4% |
| 尼日尔 (Niger) | 7,296,781 | 6,767,785 | 9,736,567 | 8,298,491 | +15.5% |
| 贝宁 (Benin) | 8,532,851 | 9,821,960 | 6,951,995 | 4,536,510 | -9.7% |
| 冈比亚 (Gambia) | 5,616,570 | 8,048,163 | 8,376,433 | 6,631,470 | +22.1% |
7.2 Fastest Growing Markets (2022-2024)
Markets with over 1 million KG in 2022, ranked by growth rate:
- Ghana: +57.6% growth (24.5M → 38.6M KG)
- Gambia: +49.1% growth (5.6M → 8.4M KG)
- Niger: +33.4% growth (7.3M → 9.7M KG)
- Mauritania: +26.0% growth (12.6M → 15.9M KG)
- Algeria: +20.4% growth (11.5M → 13.8M KG)
7.3 Markets with Significant Decline (2022-2024)
- Cameroon: -33.4% decline (11.2M → 7.4M KG)
- Mali: -28.6% decline (9.2M → 6.6M KG)
- Russia: -19.2% decline (19.7M → 15.9M KG)
- Benin: -18.5% decline (8.5M → 7.0M KG)
- Uzbekistan: -11.9% decline (24.9M → 22.0M KG)
7.4 2025 YTD Performance (Major Markets)
Change vs. 2024 YTD for markets over 5 million KG:
- Senegal: +69.9% (11.0M → 18.8M KG)
- Ghana: -54.1% (30.9M → 14.2M KG)
- Uzbekistan: +44.6% (14.8M → 21.4M KG)
- Algeria: +29.4% (8.6M → 11.1M KG)
- Morocco: +23.2% (55.6M → 68.6M KG)
- Cameroon: +21.9% (5.2M → 6.4M KG)
- Mauritania: +18.5% (11.7M → 13.9M KG)
- Germany: +10.8% (6.4M → 7.1M KG)
8. KEY FINDINGS AND STRATEGIC INSIGHTS
8.1 Overall Market Dynamics
- Strong Overall Growth: Despite being only 9 months into 2025, exports are on track to exceed 2024 levels when annualized (+2.4% projected). The current YTD shows a 4.6% increase.
- Market Recovery After 2023: After a slight decline in 2023 (-2.0%), the market rebounded strongly in 2024 (+8.8%) and continues positive momentum in 2025.
- Volume Concentration: The top 10 destinations account for approximately 52% of total exports.
8.2 Tea Type Trends
- Pure Green Tea Dominance: Pure green tea (绿茶, excluding jasmine/flower/white) has grown from 83.6% of exports in 2022 to 87.8% in 2025 YTD. The +15.8% YTD growth demonstrates strong and sustained global demand for traditional green tea.
- Unfermented Tea Category Strength: All unfermented teas combined (green + jasmine + flower + white) represent 89.8% of total exports in 2025. While pure green tea dominates, jasmine tea (1.8% of exports) shows healthy growth with 5.46 million KG exported YTD.
- Black Tea Collapse: The dramatic 54.5% decline in black tea exports is alarming. After strong growth in 2024 (+68.7%), black tea has fallen from 12.3% to just 6.2% of total exports.
- Specialty Tea Decline: Both oolong tea (-30.8%) and dark tea/puerh (-25.3%) are experiencing significant declines, suggesting challenges in premium tea segments.
8.3 Geographic Insights
- African Market Expansion: Africa has become the cornerstone of China’s tea export strategy. Key observations:
- North Africa: Morocco remains the #1 destination with steady growth
- – West Africa: Explosive growth in Côte d’Ivoire (+396.8%), Mali (+389.3%), and Senegal (+69.9%)
- Sahel Region: Mauritania, Niger, and Chad show strong, consistent demand
- Trade Patterns: Nearly exclusive preference for green tea (99%+ in most markets)
- Ghana Anomaly: After being a growth star (2022-2024: +57.6%), Ghana’s sharp reversal in 2025 (-54.1%) is concerning.
- Central Asian Dynamics: Uzbekistan shows resilience with +44.6% YTD growth after 2022-2024 decline, suggesting market recovery or renewed trade relationships.
- Developed Markets Declining: Traditional markets showing weakness:
- Russia: Continued decline (-10.1% CAGR 2022-2024)
- USA: Inconsistent performance (-5.4% CAGR)
- Germany: Modest decline (-5.5% CAGR)
- Japan: Stable but modest growth (+3.0% CAGR)
8.4 Emerging Patterns
- Trade Route Shifts: The dramatic growth in West African markets (Mali, Côte d’Ivoire) suggests new trade routes or distribution networks being established, possibly through North African hubs.
- Product-Market Fit: African markets show clear preference for green tea, while Asian markets (Japan, Russia) maintain diverse portfolios including oolong and specialty teas.
- Seasonal Strength: September 2025’s strong performance (+7.7%) indicates sustained momentum through Q3, with particular strength in green tea exports (+17.7%).
9. CONCLUSION
China’s tea export industry demonstrates overall resilience and growth in 2025, with YTD volumes up 4.6% and annualized projections suggesting continued expansion. The sector has focused on African markets, which constitute the majority of top destinations and show exceptional growth rates.
However, Ghana’s sudden reversal from growth star to declining market raises questions about market sustainability.
The data reveals a clear strategic direction: China’s tea export future lies increasingly in African markets, particularly for green tea varieties.
Looking forward, the strong September performance and positive YTD trends suggest 2025 will likely achieve full-year growth.