
SUMMARY: China’s tea exports are earning more for less volume, while US imports of Chinese tea fall sharply. Through the first eight months of 2026, China shipped 6.1% less tea than a year ago but earned 1.4% more because average price rose 8.0%. US imports of Chinese tea fell much harder, down 29.2% in volume, though total spending dropped only 3.0%. Black tea is the weak spot on both sides of the trade, and organic green tea is the one bright spot in US imports.
Period covered: January through August 2026 compared with January through August 2025. Sources: China customs export data and US Census Bureau import data (HS code 0902), compiled by Firsd Tea North America.
THE KEY NUMBERS
- China tea exports: 252,493 metric tons (MT), down 6.1%
- China tea export value: $990.8 million, up 1.4%
- China average export price: $3.92 per kg, up 8.0%
- US tea imports from China: 5,602 MT, down 29.2%
- US spending on tea from China: $33.6 million, down 3.0%
- US organic tea imports from China: 967 MT, up 20.8%
WHAT ARE THE TRENDS IN CHINA’S TEA EXPORTS?

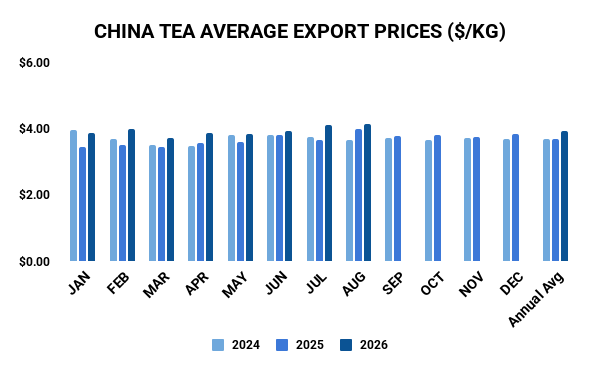
China is selling less tea, but at better prices. Exports totaled 252,493 MT through August, down from 268,897 MT a year earlier. Export value edged up from $976.9 million to $990.8 million, and the average price climbed from $3.63 to $3.92 per kg.
The month-by-month picture is uneven. Volume was down in five of the eight months (January, March, May, July and August), up in February (27.6%) and April (1.7%), and flat in June. August was the weakest month, down 18.4%. Prices were higher than a year earlier in every single month, but August’s gain was only 3.9%, which is why value fell 15.2% that month along with volume.
How are green and black tea exports doing?
They are moving in opposite directions on price. Green tea, which makes up most of China’s exports, shipped 219,527 MT, down 7.1%. But its price rose 13.7% to $3.74 per kg, so green tea export value actually grew 5.7% to $820.9 million. Green tea prices were up in every month of the year.
Black tea tells the opposite story. Volume held up fairly well, down just 3.6% to 16,005 MT, but the average price fell 30.0% to $3.83 per kg. That cut black tea export value by 32.5%, from $90.9 million to $61.3 million. Black tea prices were lower than a year earlier in every month, with the steepest drops in May (54%) and June (51%).
Which export destinations are changing the most?
Morocco is still China’s largest tea customer by a wide margin, but it is buying less. Shipments there fell 11,857 MT (19.8%), and Morocco’s share of China’s exports slipped from 22.3% to 19.1%. Other markets with big declines include Senegal (down 32.0%), Ghana (down 28.2%) and Libya (down 56.8%). Together, those four markets account for 25,201 MT of lost volume.
Several other markets grew. Mali rose 45.1%, Benin 60.4%, Mauritania 25.8%, Niger 18.1% and Cote d’Ivoire 16.8%. Combined, these five added 11,373 MT, which offsets less than half of what the four declining markets lost.
Some of the most interesting changes are in value rather than volume. Japan took 17.6% more tea and paid 38.6% more, bringing its purchases to $53.1 million. Germany bought 2.9% less tea but spent 34.1% more.
What about the United States?
The US is a small destination by volume (about 2.6% of China’s exports, or 6,616 MT), but a high-priced one. China’s customs data shows US-bound volume down just 1.6%, while value rose 32.8% to $53.4 million. The average price on those shipments rose from $5.97 to $8.06 per kg. That picture is quite different from what US import records show, which is covered below.
WHAT ARE THE TRENDS IN US IMPORTS OF CHINESE TEA?

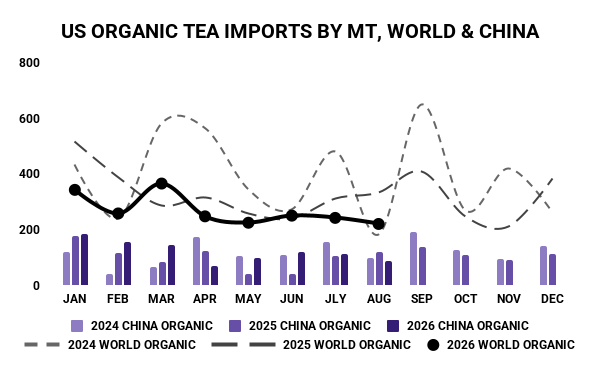
The US is buying far less tea from China than a year ago, and the decline is speeding up. Imports totaled 5,602 MT through August, down from 7,916 MT. But because the average price jumped 37.0% (from $4.37 to $6.00), total spending fell only 3.0%, from $34.6 million to $33.6 million.
Only one month showed strong growth: June, up 42.0%. April and May were roughly flat. January through March were down 25% to 47%, and the two most recent months were the worst: July fell 49.0% and August fell 55.4%. Together, July and August imports were down 52% in volume and 30% in value.
China’s overall position in the US market has shrunk as a result. Total US tea imports from all countries fell just 5.5% in volume, so China’s share of US imports dropped from 10.1% to 7.6%.
How are green and black tea imports from China doing?
Black tea is where the damage is concentrated. US imports of Chinese black tea fell 46.6%, from 3,662 to 1,957 MT, and value dropped 27.0% to $9.2 million. August was especially sharp, down 75%. China’s share of all US black tea imports fell from 5.6% to 3.1%.
Green tea has held up better. Volume fell 14.3% to 3,645 MT, but the unit price rose 29.2% to $6.69 per kg, so value actually increased 10.7% to $24.4 million. China’s share of US green tea imports barely moved, from 32.9% to 31.3%.
What is happening with organic tea imports?
Organic is the one category growing. US imports of organic tea from China rose 20.8%, from 800 to 967 MT, and value rose 20.4% to $7.7 million. Almost all of that is organic green tea (up 22.9% to 943 MT); organic black tea is only about 24 MT.
Organic now makes up 17.3% of China’s tea shipments to the US by volume, up from 10.1%, and 22.9% by value, up from 18.5%. The price stayed steady at about $8.00 per kg.
The comparison with other suppliers is striking. Total US organic tea imports from all countries fell 18.7% in volume, so China’s share of the US organic market rose from 30.3% to 45.1% by volume. By value the share was flat (15.3% to 14.7%), because the average price of US organic imports from all countries rose 54% while China’s stayed level.
One caution: organic volumes are small, and the monthly numbers swing widely, from down 45% in April to up 206% in June. The overall trend is positive, but individual months should be read with care.
Why don’t China’s export data and US import data match?
China’s customs data shows US-bound volume down 1.6% and value up 32.8%. US Census data shows volume from China down 29.2% and value down 3.0%. Both are drawn directly from each country’s official records. The two systems can differ in timing, product classification and valuation, and the data does not show which factor, if any, explains the gap.
FREQUENTLY ASKED QUESTIONS
How much tea did China export in the first eight months of 2026?
252,493 MT, down 6.1% from the same period in 2025, with export value up 1.4% to $990.8 million.
Is the price of Chinese tea going up?
On average, yes: China’s export price rose 8.0% to $3.92 per kg. Green tea rose 13.7% while black tea fell 30.0%.
How much have US imports of Chinese tea fallen in 2026?
Volume is down 29.2% through August, and the declines in July and August were 49.0% and 55.4%.
Is China’s organic tea business with the US growing?
Yes. US organic tea imports from China rose 20.8% in volume through August, even as total US organic imports fell 18.7%.
Which countries buy the most Chinese tea?
Morocco is the largest by a wide margin, followed by Uzbekistan and Mauritania. Morocco’s purchases are down 19.8% this year.
About this data: All volumes are in metric tons (MT); prices are shown per kilogram. Organic tea cannot be separated in China’s customs data, so the organic analysis covers US imports only. US import records identify China and a world total only, so the destination analysis covers China’s exports.
Firsd Tea North America compiles monthly China export and US import tea trade data from customs sources (HS code 0902). For sourcing inquiries or custom trade data requests, contact your sales representative, or email: info@firsdtea.com.