
China Tea Exports Fell in July 2026 as US Import Volume from China Dropped Sharply
China exported 28.0 million kg of tea in July 2026, down 14.7% year-over-year, at an average price of $4.12/kg. Over the full January-July period, China’s export volume ran 4.2% below the same months of 2025 while prices rose 8.8%. US imports of tea from China fell even more steeply, down 49.0% in July alone and down 25.4% for the January-July period, even as the price the US paid per kilogram rose 37.7%. Green and black tea moved in opposite price directions on both sides of the trade relationship.
Data source: China customs export data (HS code 0902) and US Census Bureau import data (GATS, HS code 0902), compiled by Firsd Tea North America. Report period: July 2026, with January-July 2026 year-to-date trend.
AT A GLANCE: JULY 2026 AND JANUARY-JULY 2026 KEY FIGURES
- China total tea exports, July 2026: 28.0 million kg, down 14.7% year-over-year
- China total tea exports, Jan-Jul 2026 YTD: 223.6 million kg, down 4.2% year-over-year
- China average export price, Jan-Jul 2026 YTD: $3.90/kg, up 8.8% year-over-year
- China green tea exports, Jan-Jul 2026 YTD: 194.7 million kg, down 4.9%, price up 14.6% to $3.72/kg
- China black tea exports, Jan-Jul 2026 YTD: 14.2 million kg, down 3.7%, price down 28.8% to $3.80/kg
- US tea imports from China, July 2026: 511.2 metric tons, down 49.0% year-over-year
- US tea imports from China, Jan-Jul 2026 YTD: 5,144.2 metric tons, down 25.4% year-over-year
- US average import price from China, Jan-Jul 2026 YTD: $5.90/kg, up 37.7% year-over-year
- Top China export destination by volume, Jan-Jul 2026 YTD: Morocco, 43.6 million kg, down 16.1%
HOW MUCH TEA DID CHINA EXPORT IN JULY 2026?
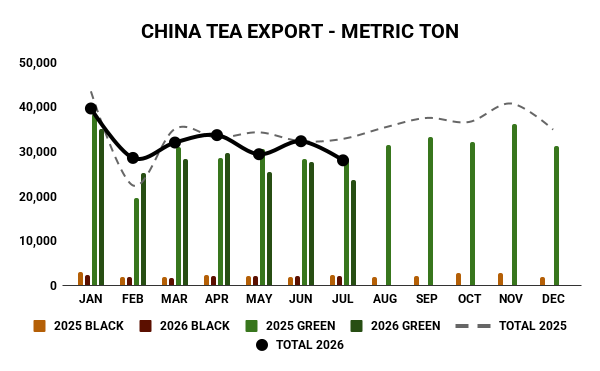
China exported 28,014,271 kg of tea worldwide in July 2026, down 14.7% from 32,832,459 kg in July 2025. The average export price was $4.12/kg, up from $3.66/kg a year earlier. July’s decline followed an uneven first half of the year: exports were down in January, March, and May, up sharply in February, and roughly flat in April and June.
Month-by-month China export volume, 2026 vs. 2025:
- January: 39.7 million kg, down 8.9%
- February: 28.6 million kg, up 27.6%
- March: 32.0 million kg, down 8.7%
- April: 33.7 million kg, up 1.7%
- May: 29.4 million kg, down 14.3%
- June: 32.3 million kg, up 0.0%
- July: 28.0 million kg, down 14.7%
For the full January-July 2026 period, China exported 223.6 million kg of tea, down 4.2% from 233.5 million kg over the same months of 2025.
DID CHINA’S TEA EXPORT PRICES RISE IN 2026?
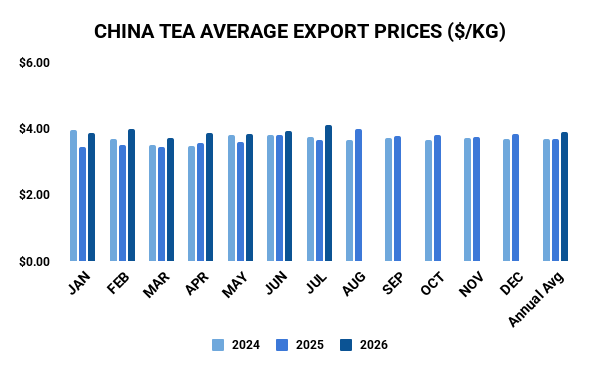
Yes, on average, but green and black tea moved in opposite directions. China’s overall average export price rose 8.8% year-over-year to $3.90/kg for the January-July period. Green tea, which makes up the large majority of China’s tea exports, saw its average price rise 14.6% to $3.72/kg even as volume declined 4.9% to 194.7 million kg. Black tea moved the other way: its average price fell 28.8% to $3.80/kg, while volume declined by a similar margin to green tea, down 3.7% to 14.2 million kg. This is an aggregate figure across all tea types and HS code classifications and should not be read as a price trend for any single grade or product category, since pricing varies significantly by tea type and form.
WHICH COUNTRIES ARE DRIVING CHANGES IN CHINA’S TEA EXPORTS?
Morocco remains China’s largest single tea export destination by volume, but it also posted one of the largest declines: 43.6 million kg in the January-July 2026 period, down 16.1% from 51.996 million kg a year earlier. Several smaller markets grew substantially in percentage terms over the same period: Mali rose 49.2% to 7.9 million kg, Niger rose 41.6% to 7.9 million kg, Mauritania rose 41.2% to 13.8 million kg, and Cote d’Ivoire rose 34.2% to 9.4 million kg. On the decline side, Libya fell 57.0% to 2.8 million kg, Ghana fell 33.7% to 8.4 million kg, and Senegal fell 32.9% to 10.1 million kg.
Top 8 destinations for China’s tea exports by volume, January-July 2026 YTD:
- Morocco: 43.6 million kg, down 16.1%
- Uzbekistan: 14.3 million kg, down 7.5%
- Mauritania: 13.8 million kg, up 41.2%
- Senegal: 10.1 million kg, down 32.9%
- Cote d’Ivoire: 9.4 million kg, up 34.2%
- Russia: 9.0 million kg, down 9.7%
- Ghana: 8.4 million kg, down 33.7%
- Algeria: 8.0 million kg, down 7.8%
The United States ranked 13th among China’s export destinations by volume in the January-July 2026 period.
HOW MUCH TEA DID THE US IMPORT FROM CHINA IN JULY 2026?
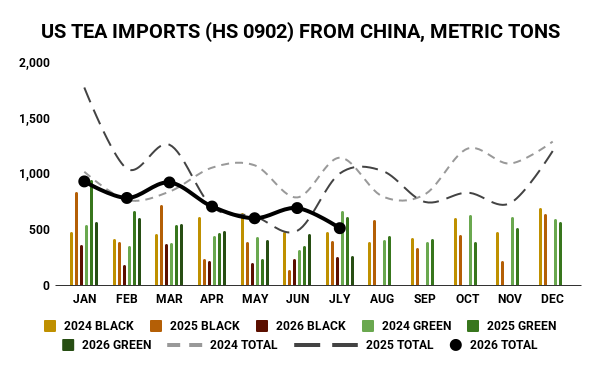

The US imported 511.2 metric tons of tea from China in July 2026, down 49.0% from 1,002.5 metric tons in July 2025, at an average price of $7.25/kg, up from $4.76/kg a year earlier. Import volume was uneven across the first seven months of 2026: January and July saw the steepest year-over-year declines, while June was the only month of substantial growth.
Month-by-month US tea imports from China, 2026 vs. 2025:
- January: 931.1 metric tons, down 47.5%
- February: 782.5 metric tons, down 25.2%
- March: 921.9 metric tons, down 26.9%
- April: 705.4 metric tons, up 0.1%
- May: 600.3 metric tons, down 2.7%
- June: 691.8 metric tons, up 42.0%
- July: 511.2 metric tons, down 49.0%
For the full January-July 2026 period, the US imported 5,144.2 metric tons of tea from China, down 25.4% from 6,892.3 metric tons over the same months of 2025.
DID GREEN TEA OR BLACK TEA IMPORTS FROM CHINA DECLINE MORE?
Black tea declined more steeply. US imports of Chinese black tea fell 41.2% year-over-year to 1,811.6 metric tons for the January-July 2026 period, while green tea imports fell 13.2% to 3,269.1 metric tons over the same period. Unit prices rose for both categories: green tea import prices rose 30.6% to $6.51/kg, and black tea import prices rose 35.9% to $4.57/kg.
FREQUENTLY ASKED QUESTIONS
How much tea did China export in July 2026?
28.0 million kg, down 14.7% from July 2025.
What was China’s average tea export price in the first seven months of 2026?
$3.90 per kg, up 8.8% from $3.58/kg over the same period in 2025. This is an aggregate figure and varies by tea type and grade.
How much did US tea imports from China fall in 2026?
US imports from China fell 25.4% year-over-year for the January-July 2026 period, and 49.0% in July alone.
Which country is China’s largest tea export destination?
Morocco, at 43.6 million kg for January-July 2026, though that volume was down 16.1% from the same period in 2025.
Did green tea or black tea prices rise more in 2026?
Green tea. China’s green tea export price rose 14.6% year-over-year while black tea export price fell 28.8% over the same period.
Firsd Tea North America compiles monthly China export and US import tea trade data from customs sources (HS code 0902). For sourcing inquiries or custom trade data requests, contact FTNA at 201.528.7916 or visit firsdtea.com.